When you’re trying to build quality links, one of the best ways to do that is by creating interesting content and pitching writers to secure media coverage.
But in order to be successful, your content has to be newsworthy.
One of the most common newsworthy elements is timeliness, meaning the information is either brand new or relevant right now.
Most brands aren’t operating full newsrooms and don’t have the capacity to cover breaking news, but there are still ways to participate in relevant, newsworthy conversations — and surveys are a great option.
I’m going to walk through how you can utilize surveys to add value to conversations, and earn the interest of writers at top publications.
Step 1: Identifying the trends
Saying “trends” is honestly too broad, because a trend can last for hours, days, months, or even years. Obviously, the shorter the trend, the harder it’ll be to contribute in a timely fashion.
For the purpose of building links, I tend to ignore Google Trends, Twitter trends, and other rapidly changing interests, because you’ll need at least a handful of days to put a survey together, and there’s no guarantee the topic will still be popular by the time you’re done.
Instead, I look for trends that last in the range of months, as they accommodate longer-term conversations and give you the room to explore new angles and perspectives without racing against time.
Here are some ways to identify these types of trends:
-
Keyword research: When keywords and topics have a high volume, that means there’s a great deal of interest; often these tools use historical data to inform their volume estimates, so it’s safe to assume these topics didn’t just start trending.
-
Exploding Topics: The goal of this site is to help people identify trends before they peak so they can contribute while the conversation is becoming more and more relevant. Keep tabs on topics related to your industry to get ideas.
-
BuzzSumo: When using this tool, check out the Content Analyzer and type in your niche. But don’t just look at the stories that have gotten the most engagement — see if there’s a story or pattern in the first couple of pages of results. Perhaps there’s an underlying trend there.
-
Join communities: See what topics are being discussed where your audience connects with others. Are there Facebook groups, Slack/Discord channels, Twitter chats, or anything else where these conversations are happening? Make sure to pay attention.
-
Publisher stories: Keep tabs on your target publications. What are they publishing stories about? What do these stories have in common?
For example, let’s look at a project we did for our client Signs.com called American Mask Mandates. As you know, COVID-19 has been a very unfortunate “trend” that’s been thrust upon us, and because it’s a once-in-a-lifetime event, the scary novelty of it has generated a lot of news stories. But you can go even further than that — what else related to COVID-19 is trending?
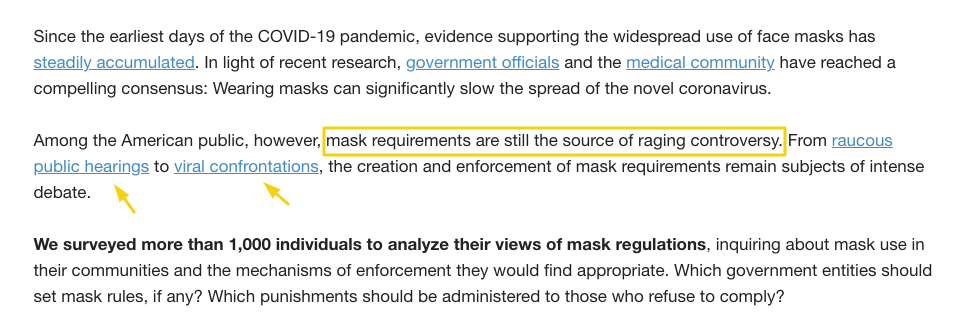
We knew mask-wearing debates were appearing constantly in the media, but it was hard to tell exactly where the general public stood on the matter separate from all the noise those sensational stories stirred up.
When we identified this trend, we decided to survey 1,000 people to get their thoughts on the issue, and we framed the timeliness and trending aspect of the story in our project’s introduction:
Once you have a few trends like this in mind, you can move on to the next part of ideation.
Step 2: Consider new perspectives
When people discuss topics that aren’t cut-and-dry (which are sometimes the most interesting topics), they often rely on their own experience to understand it.
Because of this, there are perspectives that aren’t being fully represented in the conversation, and that’s where a survey can provide a ton of value.
Ask yourself these questions to identify hidden perspectives you can tap into:
-
What does the general audience think about this topic overall? (Follow-up: Are people afraid/unwilling to share their views publicly?)
-
What is the sentiment around certain points made in this conversation?
-
Are all groups being represented here?
At this point, you should have a solid brainstorm going about 1) who you should survey and 2) what you could ask them that would unearth new insights.
For the Signs.com example, we knew this was a contentious topic, and we wanted to get a sense of how extreme the views were in the general public (rather than the few that are the loudest). But we also made sure to have a sample size of people from the different political parties for insightful demographic breakdowns (more on that later).
Here’s an example of one of the assets we created:
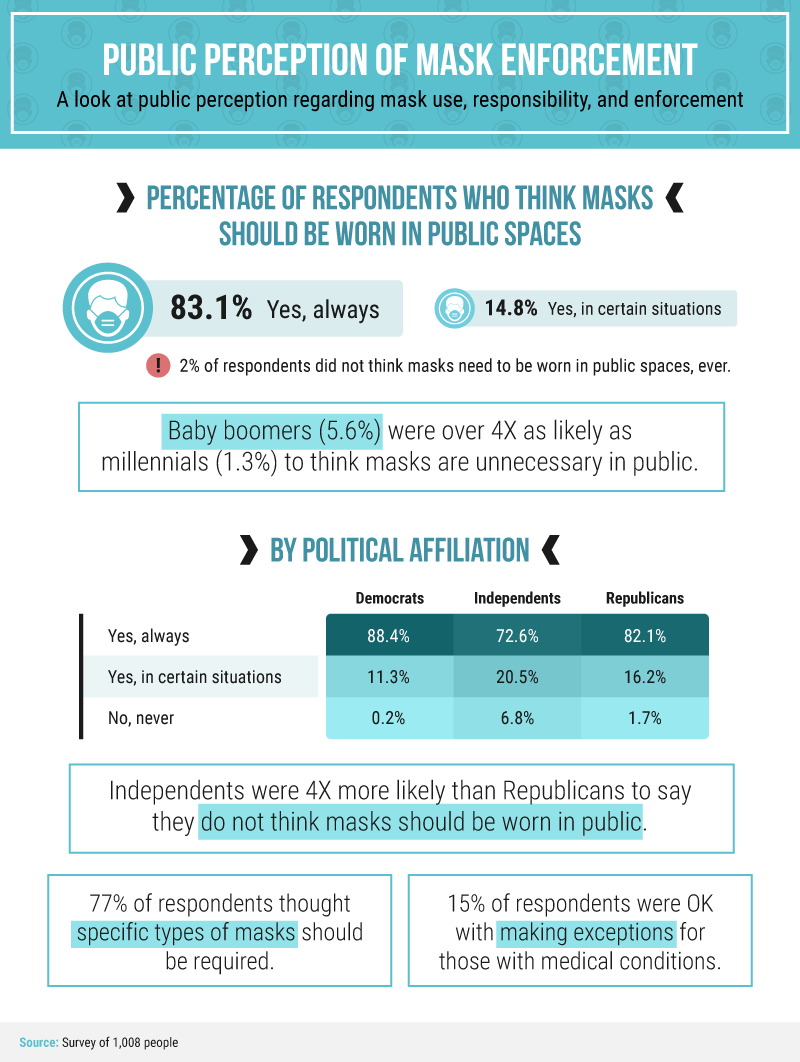
Despite all the controversy, our survey revealed a vast majority of people said masks should be worn in public. And while baby boomers were more likely to think masks were unnecessary, it was still only about 5% of surveyed baby boomers who felt that way.
By taking this perspective, we were able to get closer to the truth about perceptions of a trending topic. And the media was interested: we earned coverage for this project on Washington Examiner, MarketWatch, MSN, and more.
So how can you draft a survey with similar results?
Step 3: Drafting the survey
A guide on survey building could be a whole separate post, so I’m not going to go through this step-by-step. I will, however, provide some best practices on how to get the most fascinating takeaways out of your survey — while eliminating sources of bias.
First, you’ll want to make a list of potential questions to ask. A great way to spark ideas here is to consider what you want the final results to look like (which will of course change based on the data).
Imagine how the takeaway or eventual article headline would read. If we use the Signs.com project as an example, a theory we had was that we (the public) aren’t actually as in-conflict as we’re led to believe. From there, we imagined what the headline (that actually ended up featured on MarketWatch) could be as a result of our survey questions:
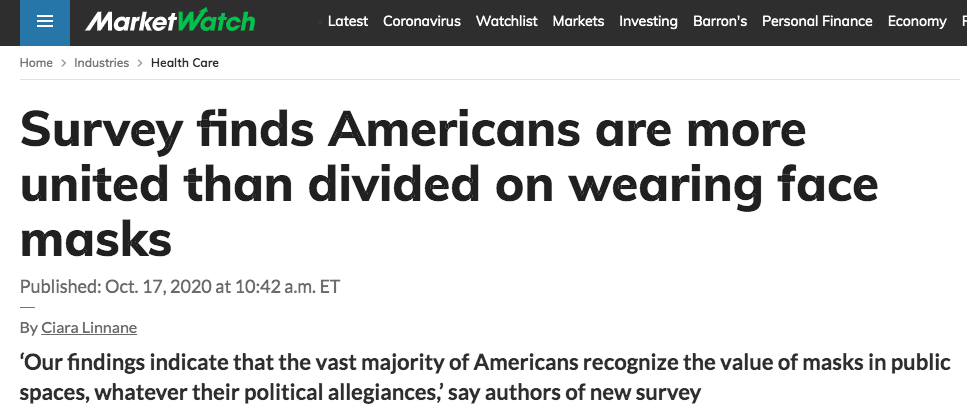
The benefit of doing this is to help you visualize whether the potential results of your survey will actually be newsworthy or interesting enough to publish. It also helps you frame your questions in a way to get the format of answers you’re looking for.
For example, the headline on Washington Examiner and MSN is: “New consensus for mask use and $225 fine for refusing.” When you’re able to imagine a potential headline like this, which cites how much the public says people should be fined for breaking mask rules, you know to ask a question about that in a specific way. If you’d asked for ranges rather than providing a fill-in-the-blank, for example, that would have meant a much clunkier headline.
However, you have to be careful not to bring your hypotheses into the survey in the form of bias.
The way you form questions can definitely impact the results you get and make them significantly more subjective if you’re not careful. Consider the following:
-
Are your scales biased? Are you asking, “How annoying is this?” rather than something like “Do you find this acceptable or unacceptable?”. Providing both sides of the scale makes for a less-biased question.
-
Are all potential options presented? If you force someone to choose the answers you provide, you could be pigeon-holing them into choosing something they don’t actually want to choose. Always include an “Other” option as well as a “None” or “Not applicable” option.
-
Does your question tap into social desirability bias, where people feel like they need to answer your question in a way that is socially acceptable? For example, someone may not want to admit how many drinks they have per week if they’re heavy drinkers. (You can perhaps move forward if you phrase things in a non-judgmental way, ask respondents for honest answers, and remind them their input is anonymous.)
Sometimes it’s best to just ask for a fill-in-the-blank. Look at this insight we got from asking respondents how much they think people should be fined for not following mask regulations:
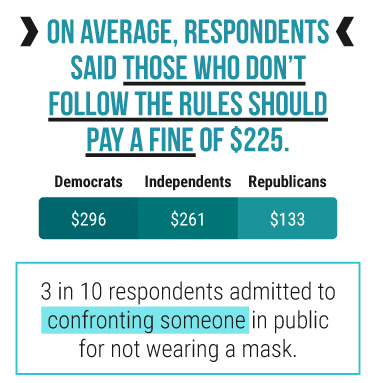
While sometimes ranges can help get an insight you’re looking for, fill-in-the-blank options help you see more specific insights. Here, you can see Democratic respondents would like a higher fine, a result which may have been lost if done with ranges.
Finally, make sure you’re asking inclusive demographic questions (and later break down your results by demographic). Doing so might reveal trends you may not have discovered otherwise, like that millennials worry about something baby boomers don’t, or that women have a different opinion than men on an issue. This is a good way to illustrate the opinion of groups who may not be well represented in a conversation.
When we broke things down by generation and political affiliation, we saw that, while there were some differences, they weren’t nearly as dramatic as some would assume. This is an important insight we would have missed otherwise.
Step 4: Promoting the results
Our strategy when doing surveys is to do all of the analysis and create images like the ones I showed previously in the article. The images should depict the data in straightforward graphs, and takeaways should highlight the key parts of your report. We build an accompanying write-up around these insights, and then we pitch everything to writers.
Remember that tip about imagining headlines? That’s going to come in handy here, too. Now that you have the final data, ask yourself: what is the most surprising or impactful information you can glean from the results?
Have this in mind when writing your pitch email, and include the key interesting facts in your pitch. Essentially, you don’t want writers guessing why they should care about your survey.
Perhaps you can even reference the trend you’re referring to and a time when that writer or publication covered the trend in a different way. How does your survey complement that story?
Conclusion
Surveys give you access to a wealth of public opinion. When you’re reading content, be mindful of what you’re wondering about. Can you confirm or deny the assumptions you’re making by launching a survey? How can tapping into other people’s perspectives add more context and value to a conversation?
Sharing your survey results can not only enliven a conversation and give it more depth — it can demonstrate you care about the topic and are willing to do the work to contribute in a meaningful way. And if you create the content and use an earned media strategy to get it out there, you can get the dual benefits of building links and brand authority simultaneously.
![]()
If you liked How to Use Surveys to Tap into Trending Conversations (and Build Links) by Then you'll love Miami SEO Expert